
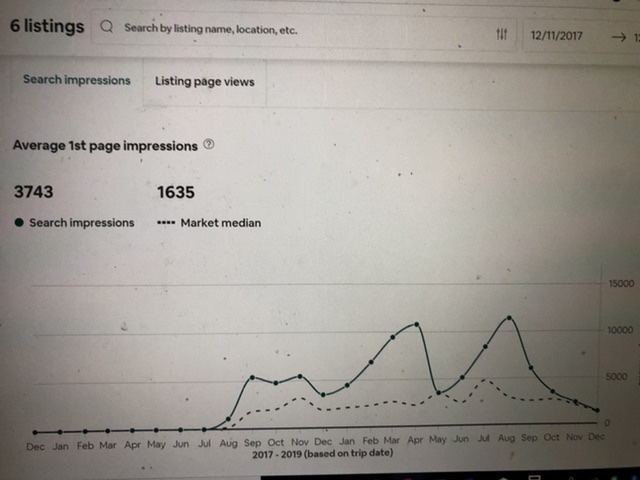
I was just looking over some of my stats and thought they were interesting, and seemingly positive for me in some ways. With the end of the year approaching I thought maybe we could all share these two visibility charts for the same period of time for ease of understanding. I’m happy to hear feedback, both sustains and improvement suggestions.
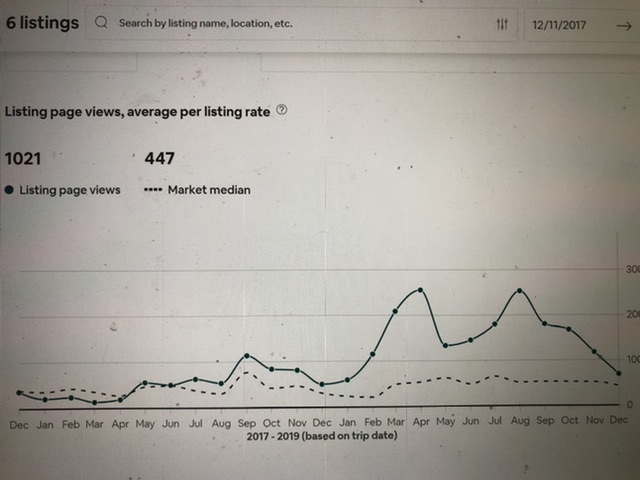
My huge drops on May are due to it being rented long term for 3 of the 4 listings (2 are permanently snoozed and have been for several years) during that time. Since October it was booked for 3 months, got reduced to 1.5 months and then dropped to only 1 month, between 2 different sets of guests.