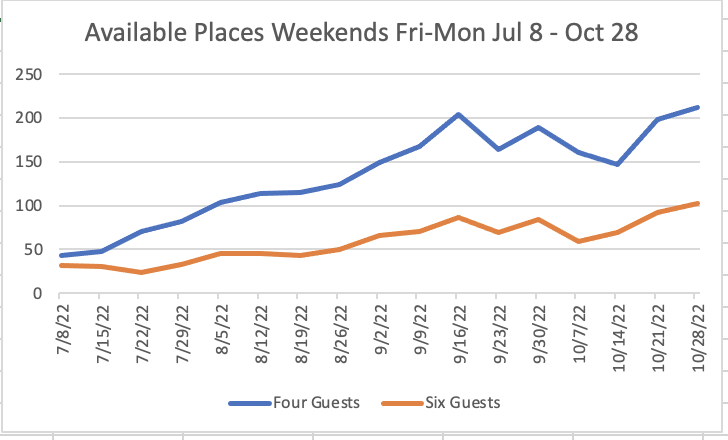
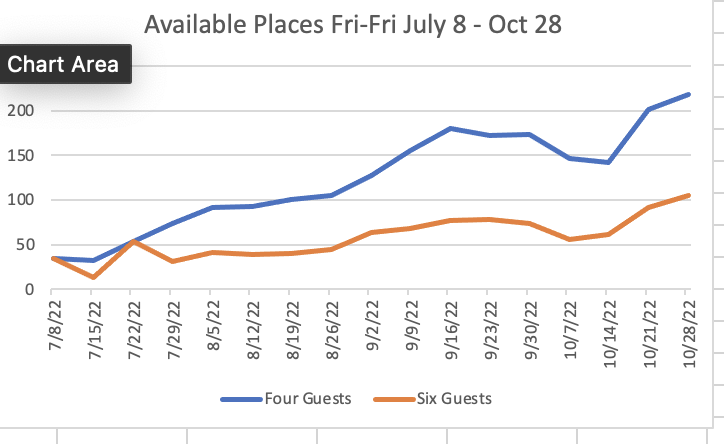
OK. I did as you suggest, showing the number of available places both for a stay with four guests, and one with six guests. I did not match the amenities of my property because I don’t really know what in my property is valued beyond the pool say in the months of July and August. Plus I just wanted to get the big-picture methodology detailed. If I were to define my competitive set beyond the pool, it would be: entire place, quality >= 4.8, # of bedrooms, bifurcated into a group that has one bathroom, and a group that has more than one bathroom. I believe a comparative advantage of my property is its aesthetic values but don’t know how to incorporate that into a qualitative model, nor what its weight would be.
I show the data and a few graphs below of the simple model of availability to accommodate four or six guests.
I’d be interested in your and others’ observations and a critique of mine.
My Observations of this market in Worcester:
Regardless of length of stay the supply of properties that can accommodate four guests is about 2.25X the number of homes that can accommodate six guests.
The supply of properties that can accommodate six guests grows more slowly in the future than does the supply of properties that can accommodate four guests.
Weekends of relatively lower demand: 9/16, 9/30 but not dramatically so
Weekends of relatively higher demand: 9/23, 10/7 but not dramatically so
Availability of properties that can accommodate six guests increases more slowly over time, suggesting higher occupancy for these properties
Nothing here suggests that the week or weekend of 10/28 will experience high demand
Here’s the data:
| Availability | |||||
|---|---|---|---|---|---|
| Weekends | 4 guests | 6 guests | 4 guests | 6 guests | |
| Fri-Mon | Fri-Fri | ||||
| 7/8/22 | 43 | 32 | 7/8/22 | 34 | 34 |
| 7/15/22 | 48 | 31 | 7/15/22 | 32 | 13 |
| 7/22/22 | 71 | 24 | 7/22/22 | 53 | 53 |
| 7/29/22 | 82 | 33 | 7/29/22 | 74 | 31 |
| 8/5/22 | 104 | 45 | 8/5/22 | 92 | 41 |
| 8/12/22 | 114 | 45 | 8/12/22 | 93 | 39 |
| 8/19/22 | 115 | 43 | 8/19/22 | 101 | 40 |
| 8/26/22 | 124 | 50 | 8/26/22 | 105 | 45 |
| 9/2/22 | 149 | 66 | 9/2/22 | 127 | 64 |
| 9/9/22 | 168 | 70 | 9/9/22 | 155 | 68 |
| 9/16/22 | 204 | 86 | 9/16/22 | 180 | 77 |
| 9/23/22 | 164 | 69 | 9/23/22 | 172 | 78 |
| 9/30/22 | 189 | 84 | 9/30/22 | 173 | 74 |
| 10/7/22 | 161 | 59 | 10/7/22 | 146 | 56 |
| 10/14/22 | 147 | 69 | 10/14/22 | 142 | 61 |
| 10/21/22 | 198 | 92 | 10/21/22 | 201 | 92 |
| 10/28/22 | 212 | 102 | 10/28/22 | 218 | 105 |
Here are some graphs


